Jake is a jock with a glorious six-pack. Oh sure, he puts in his time, playing basketball and working out at the gym five or six times a week, but good genes are also on his side. He is one of those lucky guys with a naturally muscular physique. Jake is 6 feet tall and weighs 188 pounds. His body fat was recently measured at about 8 percent. You can imagine his shock when in a college physical education class he plotted his height and weight on a body mass index (BMI) table and landed in the “overweight” zone with a BMI of 25.
For someone of only 21 years, Sherry would be considered relatively sedentary. She walks to and from the bus stop and to and from classes at college, but that’s where it ends. She doesn’t participate in any sports or other physical fitness training, unless you count dancing at the clubs every second week or so. Sherri would like to be more active, but she just doesn’t seem to have the time between school and two part-time jobs. At 5 feet 5 inches and 135 pounds Sherri has a BMI of 22 – right in the middle of the healthy weight zone. At her routine medical, Sherri was stunned to learn that her body fat was 28 percent. As it turns out, Sherri has a small bone frame and is carrying excess body fat.
These two examples help to illustrate the limitations of using body weight as an indicator of health and fitness. Body weight is important, but it is best used in conjunction with other tools, and some common sense. There is no one “ideal” weight for all people of a particular height because a person’s healthiest weight depends on bone structure, muscle mass, body fat and general body build. So how can you determine what is a healthy weight for you? How do you know if you are overweight or obese?
Let’s begin our quest by defining the phrase “healthy body weight.”
A healthy body weight is a weight at which the body functions most efficiently and effectively, affording itself maximum protection against illness and disease.
A healthy body weight is more about function and well being than socially defined beauty standards. There are three tools that, when used together, will accurately determine whether or not your body weight is healthy for you. They include:
- Body Mass Index (BMI) – takes into consideration height and weight.
- Percent Body Fat – takes into consideration total fat stores.
- Body Shape – takes into consideration distribution of body fat.
Body Mass Index (BMI)
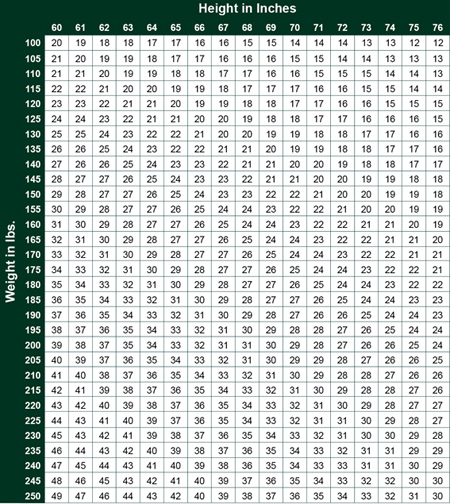
The old standard for determining ideal body weights were height weight charts. You would simply plug your height, weight and frame size into a chart to see if you fell within the ideal or healthy range. While these charts were useful, they had limitations. Today, the most widely used tool to determine if a person is in a healthy weight range is the Body Mass Index (BMI). We can determine BMI by using an equation [weight (kg) (1 kg = 2.2 lbs) ÷ height (meters) 2 (1 meter = 39.4”)], or a BMI chart (see BMI chart below).
BMI is recommended for people ages 20 to 65, but is not been considered valid for some people. For example, A BMI of 18.5 to 24.9 is considered in the healthy weight range. Those with a BMI below 18.5 are considered underweight and at an increased health risk. A BMI of 25 to 29.9 is considered overweight. Obesity is generally defined as a BMI greater than 30; severe obesity greater than 35 and morbid or extreme obesity greater than 40. Research suggests that those with a BMI of 19 to 22 enjoy the greatest longevity. BMI does not factor in muscle mass, so very muscular people will have a high BMI, but could have a very low percentage body fat (thus, they appear “overweight” according to BMI, but are actually very lean). Jake is a perfect example of this. In addition, very short people (5 feet/ less than 1.5 meters tall) may have higher BMI than would be expected relative to their size. BMI is not useful for pregnant women or those over the age of 65. To find your BMI, plot your height and weight on the BMI chart.
Percent Body Fat
While BMI is a measure of body fatness, as you saw with both Jake and Sherry, it is best to get a second opinion. So, step number two is getting a reasonable measure of body fatness.
There are numerous ways to measure percent body fat, although the most common methods include hydrodensitometry (underwater weighing), DEXA (dual energy X-ray absorptiometry) and anthropometry (skinfold thickness measures).
Hydrodensitometry and DEXA are both based on a two-compartment model that simply divides the body in to fat and fat-free mass. Although underwater weighing has long been considered the laboratory “gold standard,” it is highly impractical for use among the general public. Many people find it difficult, cumbersome and uncomfortable, and others are afraid of total submersion or cannot expel all the air in their lungs. DEXA is a relatively new technology using a whole body scanner that has two low dose X-rays. It is safe and noninvasive with little burden to the individual, although a person must lie still throughout the procedure which takes 10 to 20 minutes. DEXA is highly accurate, but the equipment is costly and not widely available.
The most common method of measuring body fatness is using anthropometry. Hand-held skin calipers are used to measure skinfold thickness at various body locations (3 to 7 test sites are common). Then a calculation is used to derive a body fat percentage based on the sum of the numbers. Skinfold measurements are made by grasping the skin and underlying tissue, shaking it to exclude any muscle and pinching it between the jaws of the caliper. The caliper method is based upon the assumption that the thickness of the subcutaneous fat (fat located just under the skin) reflects the total body fat, and that the sites selected for measurement represent the average thickness of the subcutaneous fat. As this is not the case for everyone, the accuracy is not as high as hydrodensitometry and DEXA.
However, skinfold measurements are easy to do, inexpensive and convenient.
Once you have a good estimate of your percentage body fat, check your numbers against the table below.
What is Your Body Shape?
Once you have figured out your BMI, and have a general idea of your level of body fatness, there is one more important factor to consider. What is your body shape? The most common descriptors of body shape are the apple and the pear. If you carry the bulk of your weight above your hips (mainly in your abdomen), you have an apple shape. People who are apple shaped sometimes have a larger waist than hips. If you are an apple shape, when you gain weight, it tends to go directly to your stomach. This body shape is more common in men.
If you carry the bulk of your weight in your extremities (your hips, thighs and buttocks), you are said to have a pear shape. People who are pear shaped generally have larger hips than waist. This body shape is more common in women.
You can easily determine whether you have an apple or pear shape by calculating your waist to hip ratio. Simply take a measurement of your waist and hips, and divide the waist measurement by the hip measurement. A ratio of 0.80 or less for women, and 0.90 or less for men is considered a pear shape. Whether you are an apple or a pear doesn’t really matter, unless you are carrying excess weight. If you are overweight or obese, having an apple shape puts you at much higher risk for heart disease, type 2 diabetes, hypertension and several types of cancer. For those who naturally become apple shaped with weight gain, it is critically important that a healthy body weight be maintained.
There is another common way to determine whether or not you are carrying excess baggage. Simply do a waist measurement. A measurement of over 32 inches for a woman and 37 inches for a man suggests that you should try to avoid gaining any more weight. A measurement of 35 inches for women and 40 inches for men indicates that health improvements could be expected with weight loss. In other words, it indicates overweight.
The Final Word
If after going through all of this, you have determined that you are underweight or overweight, do a personal inventory of your food and beverage intake and physical activity. Be brutally honest with yourself. If you are underweight, a visit to your health care provider can rule out any underlying causes of underweight, such as thyroid or adrenal abnormalities, is warranted. When an underlying disorder has been ruled out, think about how you can increase your energy intake, and in some cases, decrease your energy output. You may need to eat larger portions, increase fat intake (preferably with such high fat whole plant foods as avocados, olives, nuts and seeds) and/or eat more often.
If you are overweight or more importantly “overfat,” then you need to consider how to decrease energy intake and increase energy output. This means eating fewer calories and exercising more. Eating fewer calories does not necessarily mean eating less food. Focus your diet on whole plant foods – vegetables, fruits, legumes and grains, with smaller portions of such high fat plant foods as avocados, nuts and seeds. Limit refined carbohydrate foods made with flour and sugar. Avoid deep-fried foods and salty snack foods. Increase physical activity to 60 minutes a day. Aim for a balance of cardiovascular, strength and flexibility exercises. Finally, get support if you need it. There are plenty of people who can help you – support groups, dietitians, nutritionists, personal trainers, and a host of health care providers. By getting your body weight under control, you will be doing a lot to improve your long-term health, and the vegetarian cause. Whenever vegetarians set an example of great health, they inspire those around them to do the same.
Body Mass Index (BMI)
Understanding Your BMI
BMI < 18.5: May indicate underweight
BMI 18.5-24.9: Healthy weight for most people.
BMI 25-29.9: Indicates overweight
BMI > 30: Indicates class 1 obesity
BMI > 35: Indicates class 2 or severe obesity
BMI > 40: Indicates extreme or morbid obesity
Percent Body Fat
BODY TYPE | FEMALE | MALE |
Athlete | <17% | <10% |
Lean | 17-22% | 10-15% |
Normal | 22-25% | 15-18% |
Above Average | 25-29% | 18-20% |
Overfat | 29-35% | 20-25% |
Obese | 35+% | 25+% |